


Climate Data for the Masses
Climate change has been central to Barack Obama’s dwindling days as president. In addition to helping to shape — and successfully push through — a global climate agreement, in recent weeks and months the president has targeted emissions from aviation, fought to keep afloat his signature Clean Power Plan, and even instructed 20 federal agencies that they must consider the effects of global warming when setting national security policy.
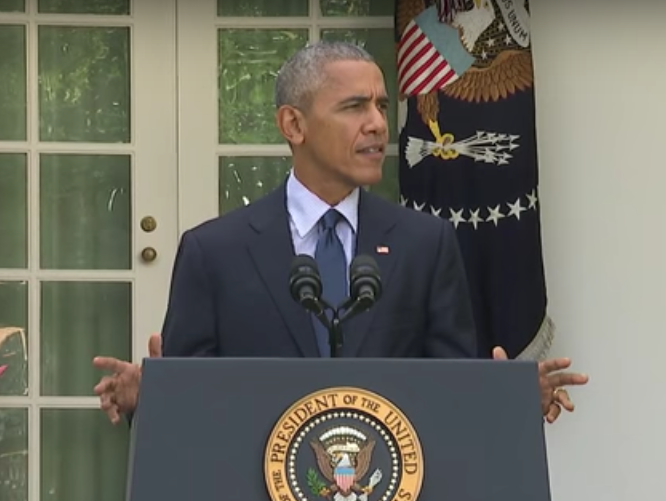
President Obama spoke this week on the occasion of nations crossing the threshold needed to bring the Paris climate agreement into force. He’s also looking to get climate data into more peoples’ hands.
Also part of that legacy-building effort: a public-private initiative launched last month by the White House Office of Science and Technology Policy (OSTP), which aims to make a wealth of climate data available to decision makers, businesses and the public through an online, visual portal.
“Critical to building climate resilience is ensuring easy access to authoritative, actionable data about ongoing and projected impacts of climate change,” said White House science advisor and OSTP director John Holdren at the launch of the Partnership for Resilience and Preparedness (PREP) at the Ford Foundation in New York.
PREP will take the form of a website displaying interactive dashboards – like this one being piloted by California’s Sonoma County – and data visualizations that can be accessed here. In addition to PREP’s web platform, Holdren announced a commitment made by the U.S. and 13 other nations, as well as businesses and organizations like Amazon, Google and the World Resources Institute, to improve accessibility to this climate data.
“Without data, climate resilience efforts will be hopeless,” said Holdren.
But while making geographical climate vulnerability data available is important, getting that information into the right hands will be one of PREP’s biggest challenges, says Javier de la Torre, a former conservation scientist and now CEO of Carto, a geospatial technology company that is building the mapping and data visualization infrastructure for PREP.
“The risk is that we become just another beautiful website that very few people use,” said de la Torre, who had been modeling invasive species when he started to build Carto “to bridge the gap between science and policymaking,” he said.
As de la Torre sees it, Carto and PREP are facing a challenge that is not unique to climate resilience planning, but one that plagues science as a whole: making research available to those that need it. “More than anything,” he said, “the most important challenge is not so much doing interesting research and models, but actually taking them to the place where they can be useful and be used.”
To that end, Carto is not only designing the climate data dashboards, says de la Torre, but also consulting with PREP’s partners on how to most effectively find, organize, analyze and visualize data for decision makers on the ground.
De la Torre and his collaborators are still in planning mode for most of the visualizations they will create, but one early case study is estimating the at-risk population and number of housing units in Kansas City’s floodplains (above). That kind of interactive map could be very helpful for people trying to assess climate risks for real estate. It’s low-hanging fruit, de la Torre admits, but it hasn’t been made freely available in this format before.
“That data has been available for a long time,” said de la Torre. “But it’s not in the hands of many organizations.” He hopes Carto can help change that while creating another upside: helping the public appreciate the scope of a problem like climate change by visualizing storm surges, flooding, heat waves, or sea level rise.
“Showing sea level rise is not only a decision tool, but also a way to visualize the dimension of the issue,” he said.
Comments are automatically closed one year after article publication. Archived comments are below.
So very glad this is happening! Now wondering about access for those outside the US. Seems to me we could learn a lot from folks in other nations and vice versa.