


In Gaza, Satellites Show 157,200 Damaged or Destroyed Buildings
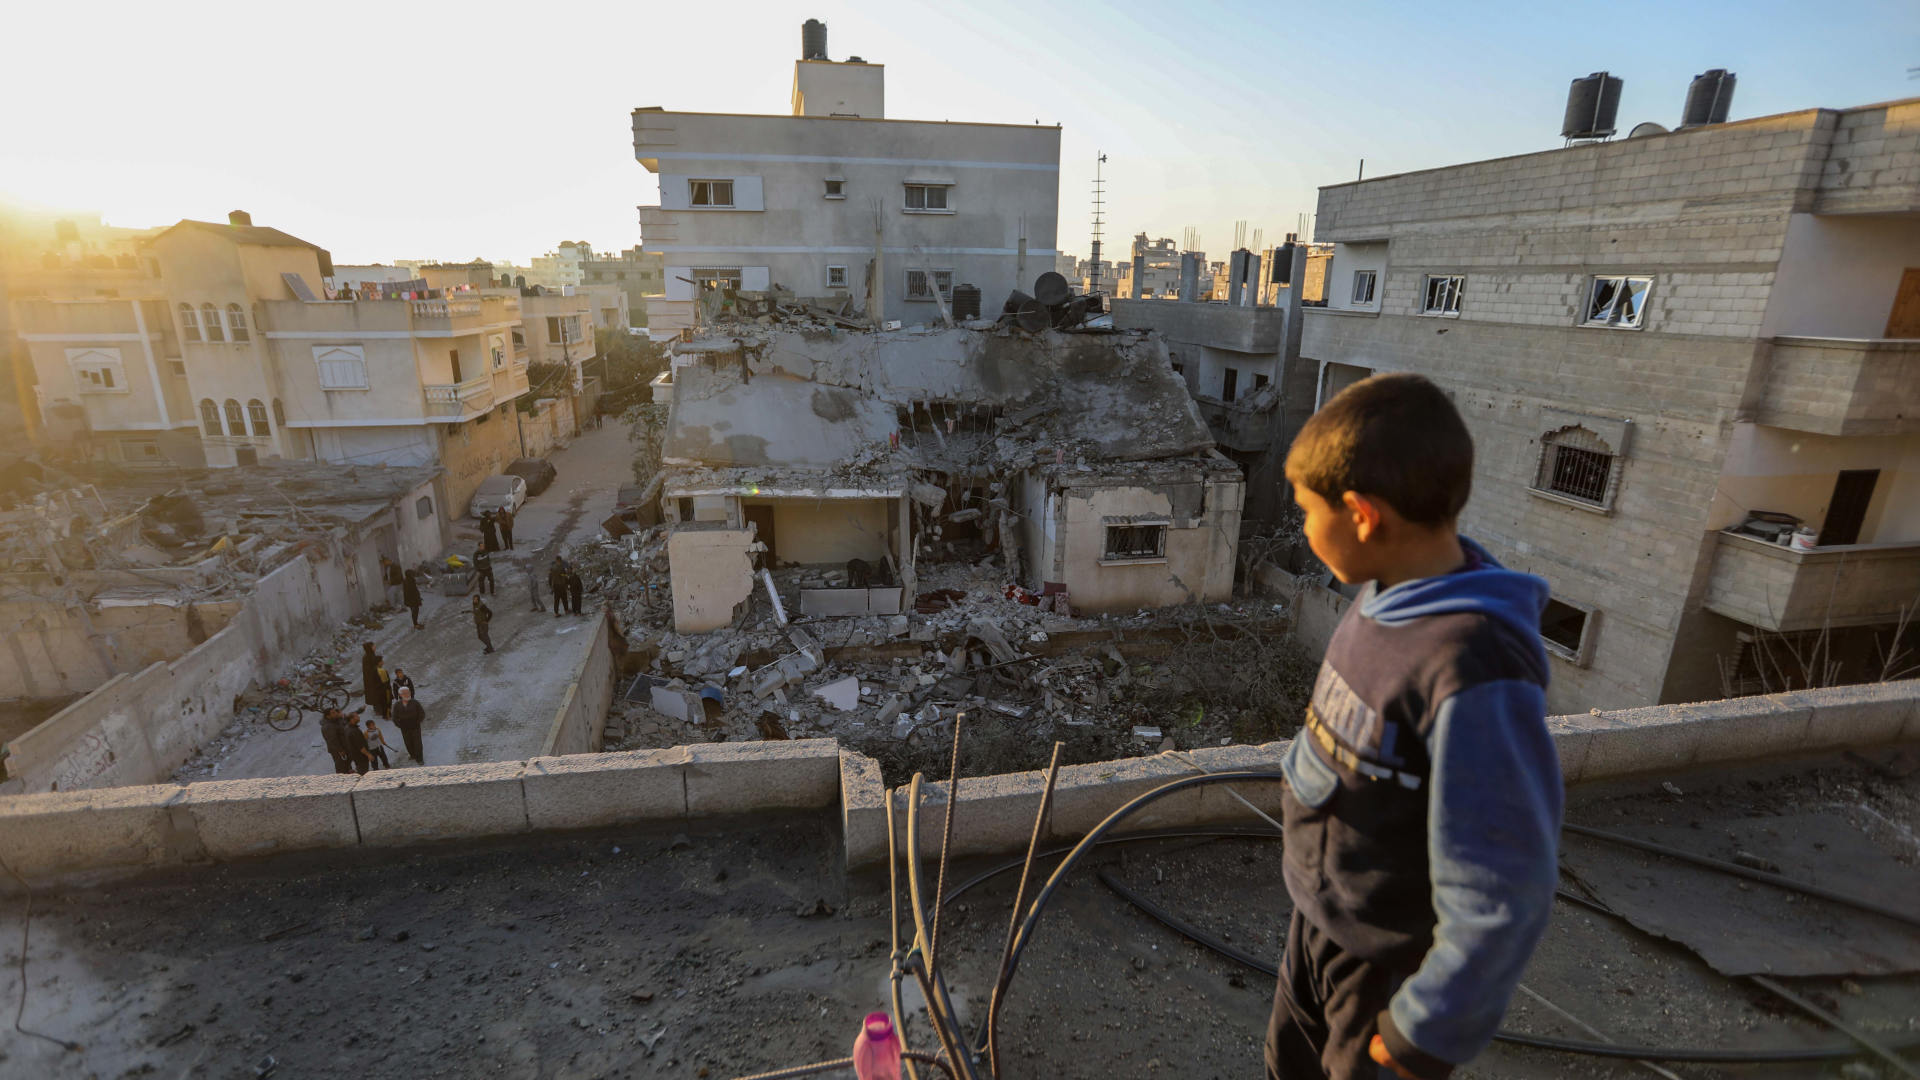
On Oct. 22, 2023 Israeli warplanes bombed buildings near Al-Quds Hospital in Gaza City, according to Reuters. Over the following weeks, airstrikes hit near the medical facility and neighboring structures, with some damage documented on video by the Palestinian Red Crescent Society. By Nov. 12, in need of both electricity and generator fuel, Gazan health officials were forced to shut down both Al-Quds and Al-Shifa, the territory’s largest hospitals.
Beyond the staggering number of deaths, Israel’s ongoing bombardment in Gaza is also taking a drastic toll on infrastructure. So far in the conflict, an estimated 157,200 buildings have been damaged or destroyed. That adds up to more than half of all buildings in the densely populated area, and nearly three-fourths in the northern parts of Gaza.
That number, updated as of March 5, comes from analysis done by Jamon Van Den Hoek, a geographer at Oregon State University, and Corey Scher, a Ph.D. candidate at the City University of New York. The pair began using public images from European Space Agency satellites last fall to document the increasing devastation of structures in Gaza, updating their findings online every week and disseminating them to more than 150 journalists. The analysis is faster than a traditional on-the-ground survey, and a safer way to track damage to the Gaza Strip, where, in addition to around 31,000 Palestinians and 247 Israeli soldiers, about 95 journalists and more than 160 United Nations aid workers have been killed.
Van Den Hoek and Scher are part of an ad hoc association known as the Decentralized Damage Mapping Group. The loose network of about 18 researchers from the United States, the United Kingdom, Germany, the Netherlands, Sweden, and Turkey came together last year to increase the understanding and use of satellite data for monitoring the impacts of conflict.
While Van Den Hoek and Scher work on urban damage mapping, others in the group are focused on documenting the conflict’s impacts on medical facilities and farmland, among other projects. For example, in his work, He Yin, an assistant professor of geography at Kent State University in Ohio, has found that a third of Gaza’s agricultural land has been directly damaged, referring to areas that have been completely destroyed or burned out. He is still assessing the indirect impacts in areas where a field may still be intact, but “there’s nothing growing because of the impacts of war,” Yin said. Van Den Hoek says Yin’s maps will soon be published on the DDMG website, alongside the urban damage maps.
“The motivation to establish DDMG came out of the need for more real-time, comprehensive awareness of environmental damages, including the built environment, during the Israel-Hamas war.”
Van Den Hoek and Scher see the work done by DDMG members as a step toward establishing a growing field called conflict remote sensing. Such independent findings from satellite data could help address disputed claims about the level and extent of damage from military attacks — though putting an end to that violence is a separate, political matter. It’s mostly been journalists disseminating the findings from such satellite imagery so far, and researchers hope they could be of use to humanitarian groups as well. Some experts have warned that satellite data could also be exploited by the military or others who want to find new targets. (Recent reporting from NPR suggests Israel may make use of such data as part of an AI-based targeting system called the Gospel.)
Public satellite monitoring has previously been used for environmental applications and for assessing impacts of natural disasters, but such tools haven’t been significantly leveraged for humanitarian purposes in conflict areas, said Van Den Hoek. The scale of the bombing and the rapidity of destruction in Gaza visible by satellite also warrant quickly and systematically collected data, he added: “The motivation to establish DDMG came out of the need for more real-time, comprehensive awareness of environmental damages, including the built environment, during the Israel-Hamas war.” Despite the need in armed conflicts, he said, “there’s very little actionable data.”
Satellites have been used in conflicts before — in particular, the commercial satellites of Capella Space and Planet Labs, both in San Francisco, and Maxar Technologies outside of Denver, which provide imagery to the Ukrainian and American governments during the war with Russia. But such images can be expensive and, for national security and other reasons, come with restrictions.
Public images may allow for broader possibilities. Van Den Hoek and Scher have been developing their analysis and mapping methods over the past few years during the war in Ukraine and in other areas, and they believe they’re applicable in Sudan and other regions as well.
“As soon as the satellite captures a new image, we can update our analysis,” Scher said. “Being open in this way enables us to deliver a sense of consistency across the duration of a conflict.”
So far, using their open-source approach, Van Den Hoek and Scher have estimated that at least 77,500 structures in northern Gaza have been damaged or destroyed since the conflict first began. The researchers have also noted the likely damage or destruction of about 22,200 structures in central Gaza and 57,500 buildings in the two most southern Gaza regions, where Israeli authorities in October told residents to flee. Van Den Hoek and Scher also observed how civilian infrastructure like hospitals, schools, and places of worship have been hit, an issue that, in December 2023, South Africa took up in a genocide case against Israel at the International Court of Justice.
Overall, throughout Gaza, the researchers’ data show that by mid-January, about half of all Gazan buildings had likely been damaged or destroyed.
For their work, Van Den Hoek and Scher took advantage of the European Space Agency and European Commission’s Copernicus Sentinel-1 and Sentinel-2, a group of Earth-observing satellites. The Sentinel-1 satellite constellation comes equipped with instruments that send out radar pulses and detect how those pulses scatter and reflect off the Earth, similar to how a bat navigates a dark landscape. While the images have lower spatial resolution than some commercial satellites — which affects the clarity of the image when assessing damage — the data is made public quickly, and for free. The researchers apply algorithms to interpret the images and spot structures that have changed over time.
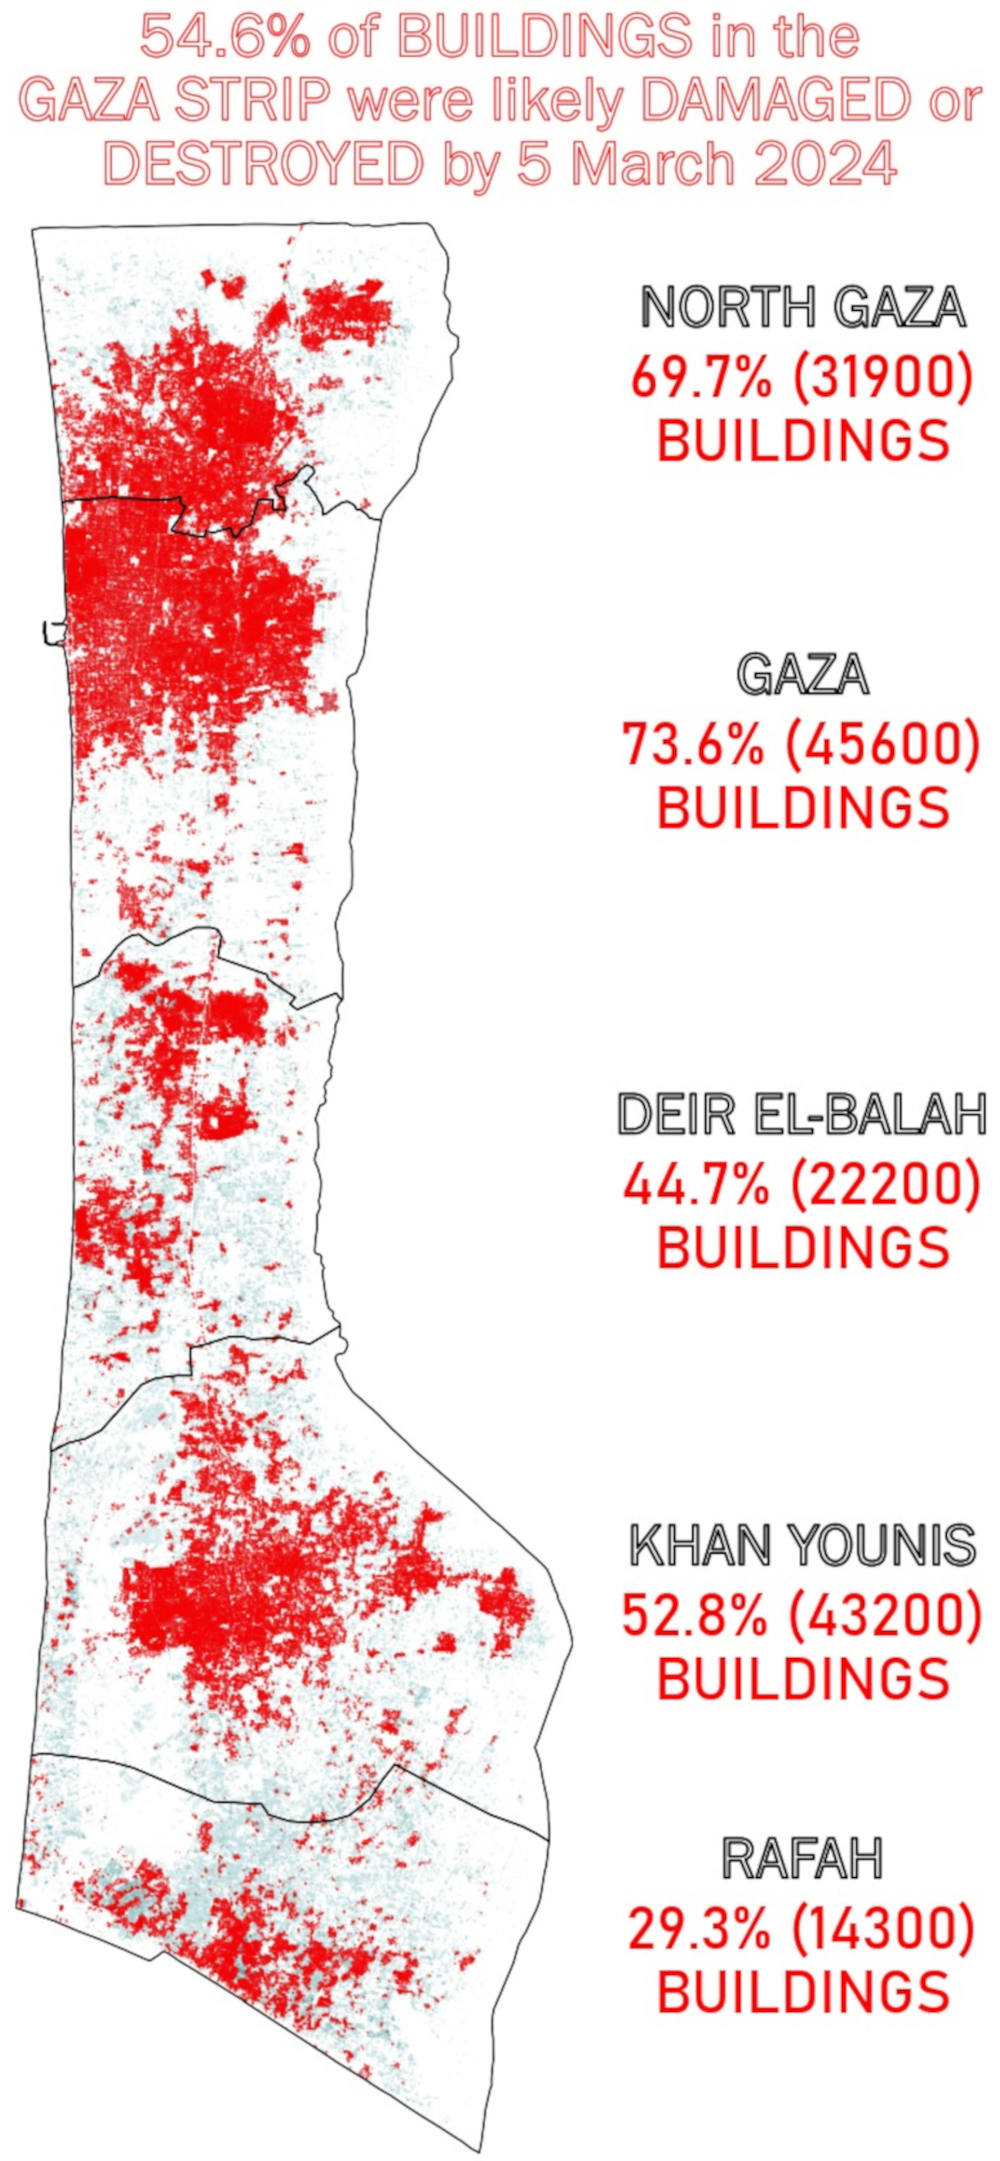
Damage analysis of Copernicus Sentinel-1 satellite data shows over half of the structures in Gaza have likely been destroyed or damaged (red). Pale blue indicates structures that are likely still intact.
Visual: Corey Scher/CUNY Graduate Center and Jamon Van Den Hoek/Oregon State University
The reliability of radar imagery is a great advantage, said James Geach, an astrophysicist at the University of Hertfordshire and co-founder of Aspia Space, a startup interpreting satellite radar for agricultural and environmental applications. “The work we’re doing is basically using the radar to cut through the clouds to provide that continuous monitoring of the ground,” he said. After all, most of the globe is cloudy most of the time. While optical imagery delivers only intermittent views, radar can be used day and night and in all weather.
Interpreting radar images can be challenging, Geach said. For one, these images are not as intuitive as optical images, which look more or less like a camera snapshot from orbit and are clear enough that even non-experts can understand them. Radar data require a trained eye and algorithms to identify key features and changes in land cover — or in Aspia’s case, to translate radar images into more easily comprehensible optical ones. But that effort is worthwhile for the continuous imagery radar provides, rain or shine, Geach said. In any case, over the past 10 years, access to both optical and radar satellite imagery has ballooned. Improvements in satellite technology, coupled with a decrease in cost to get them into orbit, Geach added, has allowed private companies to provide the same high-resolution imagery that was once only accessible to the military.
Van Den Hoek and Scher also benefit from the fact that the Sentinel-1 satellites take their images at an angle, rather than straight down, Scher said. This helps to discern damage to the walls of structures, such as collapsed buildings with mostly intact roofs. This may help explain why their estimates on building damage are higher than those from other groups, he said. Nevertheless, the researchers find at least 70 percent agreement between their damage maps and those of the United Nations Satellite Center, which has higher-resolution images but releases updates less often.
Van Den Hoek and Scher’s estimates on building damage come with some caveats. The numbers they quote are the minimum likely damaged structures in a region. Those damaged or destroyed buildings are ones they’ve found to be 99 percent or more covered with pixels marked as damaged. But those are just the buildings they’re sure about; the damage could be more extensive, but it’s harder to pinpoint. The analysis also doesn’t perform as well for small, isolated structures, such as farm buildings surrounded by fields, although it’s more accurate for dense urban areas — which is most of Gaza. (For his agricultural mapping work, Yin uses higher resolution imagery from Planet.)
There are other limitations. For instance, satellite imagery may be able to reflect the number of damaged buildings, but it can’t reveal much about the number of households affected. And in Gaza, as with many urban areas, neighborhoods are compact, with many families living close by or in the same building. Satellites also don’t substitute for the work of on-the-ground engineers, who might frequently find that structures next to a pulverized building have been structurally undermined themselves. The view from the sky can only go so far.
The DDMG have joined a growing cadre of researchers collecting satellite information of war zones. These include the U.S. State Department-funded Conflict Observatory, whose researchers have used both public and commercial satellite imagery as well as open-source intelligence — publicly available information and images posted on social media and other platforms — to study damage to Ukrainian grain silos, document village attacks in Sudan after a ceasefire declaration, and now have similar work in progress involving Gaza. “It’s been a revolution that’s been decades in the making,” said Nathaniel Raymond, executive director of Yale’s Humanitarian Research Lab, which is part of the Conflict Observatory.
Raymond cites multiple factors driving the growth of satellite imagery in conflict areas. First, satellite instruments from space agencies and, increasingly, companies now cover most of the globe, gathering more data, more frequently and cheaply than ever before. Second, remote sensing and open-source intelligence have gained legitimacy as reliable sources of information, he said, including in places that human rights monitors or journalists can’t easily reach. Gaza has quickly become the deadliest place on Earth for media workers, according to the Committee to Protect Journalists, making it tough to get independent information from within the territory.
Furthermore, Raymond argues, the public and policymakers increasingly demand more information about the scale, severity, and attribution of military attacks, such as the explosion at Al-Ahli Arab Hospital in Gaza City, as well as imagery to combat misinformation and disinformation. In short, people now have more satellites to choose from, more ways to access imagery, and more needs for such data.
The reliability of radar imagery is a great advantage, as it provides continuous imagery, rain or shine.
Data from satellite imagery can help sort claims by opposing sides of a conflict, as Israeli political leaders and Palestinian officials have disagreed about the level of destruction in Gaza and how indiscriminate the Israeli military’s strikes arguably have been. Remote-sensing data can help bring clarity to those questions, said Lina Eklund, a DDMG member and a physical geographer at Lund University in Sweden who studies how conflicts affect land and agriculture.
Some satellite archives, like NASA’s Landsat program, also go back decades, Eklund said, allowing researchers to track changes over long periods. But she acknowledges that the tools aren’t completely unbiased: “There’s always the bias of the person doing the analysis,” she said.
“There are also many downsides to actually not being in the place that you’re studying and not knowing the context completely,” she added. “So there are many things that remote sensing cannot do for you. We shouldn’t overestimate or overuse it.”
Raymond, as well as researchers who are part of DDMG and others, see their work as not merely academic, but rather providing information that could be used by humanitarian groups and disseminated in the media. Still, clear satellite data doesn’t necessarily lead to policy changes, said Lars Bromley, a specialist at the United Nations Satellite Center. “Some of the assumptions I made long ago was that by doing what we call the ‘shaming and blaming,’ by saying ‘look, we see you,’ we will actually put a stop to it,” he said. “But the gulf between documenting something and having an effect on it is quite significant.”
Bromley has testified at the International Criminal Court multiple times, but every investigation doesn’t lead to that level of attention, he added: “You can create a perfect analysis of a human rights violation, but if no one is picking up and using that to actually prosecute the individuals or have some policy change, what are you doing?”
Satellite images could make a big impact in other areas — including Sudan, South Sudan, Syria, and Myanmar.
Researchers, human rights workers, journalists, and others using satellite images should also take care in how they publish maps derived from them, Bromley said. Geostationary data could potentially be used as targeting data, such as by the Israel Defense Forces or Hamas. There also can be a national dimension, he points out: Using images from an American satellite or Chinese satellite, say, could influence how the products are perceived, particularly if the one of the countries, or their allies, play a role in the observed conflict.
Bromley said he believes satellite imagery matters in the Gaza conflict. But, he added, it’s not like human rights violations in the conflict are a secret: “All the perpetrators are gleefully filming themselves doing all this anyway.” Satellite images could make a big impact in other areas — including Sudan, South Sudan, Syria, and Myanmar — where there are rarely international observers or other eyes on the ground, and people aren’t uploading data on social media.
What’s clear is that the days of relying on official or military sources of information are over. Satellite tools and technologies are evolving and proliferating, and the science of conflict remote sensing is here, penetrating the fog of war. “More and more satellites go up faster and faster,” Bromley said. “When I started on this work, we had like one satellite we could use, and now I don’t even bother counting how many are there.”
Comments are automatically closed one year after article publication. Archived comments are below.
Israel is reaching New levels of cruelty, and not worrying of maintaining its old image of this “small oasis of democracy surrounded by uncivilized hostile dictatorships”, is creating world wide awareness of what people in Middle East have known for 78+ years: if anything good will come of this latest aggression, it would be the removal of the ambiguity of who is the culprit in this conflict, an occupier force whose Greed for more land acquisition is never satisfied, Israel fooled the world by manipulating its image while Palestinian remained unable to show the actual story as clearly as is currently obvious.